

Bitcoin (CRYPTO: BTC) has spent eight weeks grinding inside the $58,000 to $67,000 range with no breakout and no breakdown.
Yet, a decision will be forced before the end of the year, according to prominent analyst Benjamin Cowen.
Why Cowen Says A Decision Is Coming
Cowen said in a YouTube video on Monday that two converging levels are closing in on Bitcoin from both sides.
The bear market resistance band is coming down from above while the 200-week moving average is rising from below, and the gap between them is shrinking fast.
“There’s only so much longer that the bear market resistance band can go down and the 200-week moving average can go up before a decision has to be made,” Cowen said.
He put the bear market resistance band at roughly $69,000 and the 200-week moving average at $63,700.
His base case is that Bitcoin moves lower before it moves higher, pointing to on-chain indicators like the MVRV Z-score that have not yet reset to the levels historically associated with cycle lows.
Every prior midterm year showed August weakness, with negative 15% in 2022, negative 15% in 2018, and negative 18% in 2014. Cowen said by mid to late August, the window of weakness should open back up.
Bitcoin Is Now Less Volatile Than Tech Stocks — And That’s Historically Bullish
Analyst Luke Martin flagged on X that Bitcoin’s realized volatility just dropped below the Nasdaq 100’s for the past 30 days, a signal he said only appears once or twice a year.
“Everything else is trading like crypto, except for crypto,” Martin wrote.
His historical data across 12 prior instances of this signal shows:
| Timeframe | Avg Return | Win Rate |
| 7 days | 20.58% | 75% |
| 30 days | 141.81% | 100% |
| 60 days | 359.72% | 91.67% |
| 90 days | 635.94% | 100% |
| 180 days | 731.96% | 100% |
Martin called it the calm before the storm, adding the signal historically points higher rather than lower.
What ETF Flows Are Showing
Bitcoin ETFs pulled in $170.09 million Monday, with BlackRock’s IBIT leading at $111.43 million and Fidelity’s FBTC adding $33.36 million, according to SoSoValue data.
The two biggest players showing up together on the same day after last week ended with $61.53 million in net outflows points to returning institutional conviction rather than a single fund acting alone.
BTC Price Analysis: What’s Next?
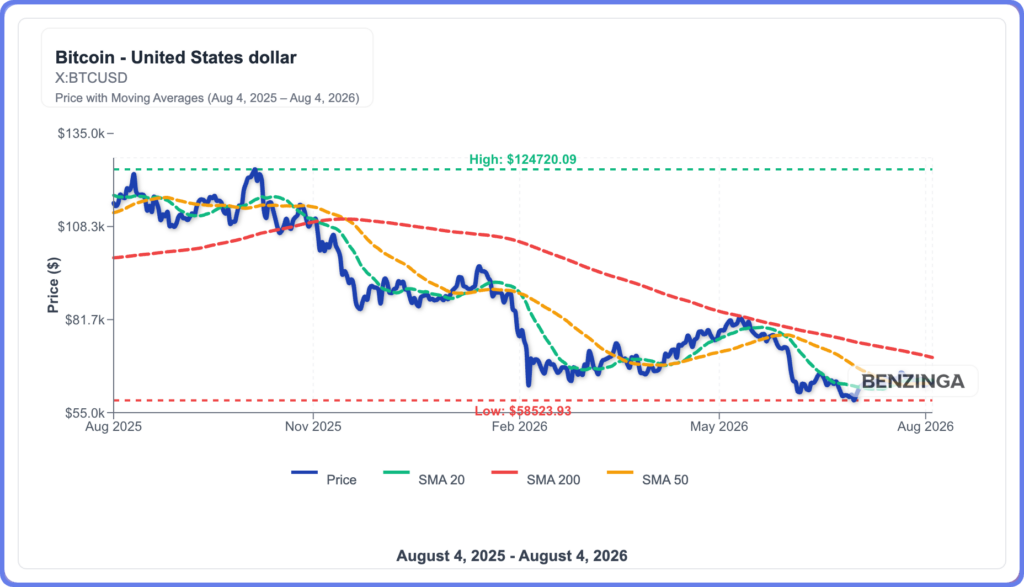
Bitcoin is stuck between the 20-day EMA at $63,890 pressing just above and horizontal support at $62,500 below.
RSI sits at 48.66, neutral and reflecting the same indecision visible on the price chart. All four EMAs stack bearishly overhead.
Key levels for Bitcoin:
| Level | Price | What It Means |
| Resistance | $64,591 | 50-day EMA, first ceiling above |
| Range Top | $67,075 | 100-day EMA; break here shifts bias bullish |
| Support | $62,500 | Horizontal floor; losing this reopens $58,000 |
Photo via Shutterstock