
Tesla (NASDAQ:TSLA) is preparing to release its quarterly earnings on Wednesday, 2026-01-28. Here’s a brief overview of what investors should keep in mind before the announcement.
Analysts expect Tesla to report an earnings per share (EPS) of $0.40.
Tesla bulls will hope to hear the company announce they’ve not only beaten that estimate, but also to provide positive guidance, or forecasted growth, for the next quarter.
New investors should note that it is sometimes not an earnings beat or miss that most affects the price of a stock, but the guidance (or forecast).
Historical Earnings Performance
During the last quarter, the company reported an EPS missed by $0.00, leading to a 2.28% increase in the share price on the subsequent day.
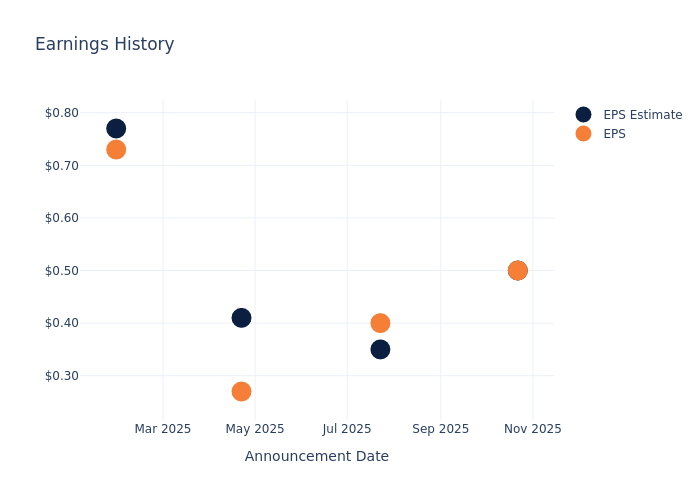
Here’s a look at Tesla’s past performance and the resulting price change:
| Quarter | Q3 2025 | Q2 2025 | Q1 2025 | Q4 2024 |
|---|---|---|---|---|
| EPS Estimate | 0.5 | 0.35 | 0.41 | 0.77 |
| EPS Actual | 0.5 | 0.40 | 0.27 | 0.73 |
| Price Change % | 2.0 | -8.00 | 5.00 | 3.00 |
Tesla Share Price Analysis
Shares of Tesla were trading at $435.2 as of January 26. Over the last 52-week period, shares are up 11.85%. Given that these returns are generally positive, long-term shareholders are likely bullish going into this earnings release.
Analyst Opinions on Tesla
Understanding market sentiments and expectations within the industry is crucial for investors. This analysis delves into the latest insights on Tesla.
Analysts have provided Tesla with 17 ratings, resulting in a consensus rating of Outperform. The average one-year price target stands at $440.19, suggesting a potential 1.98% downside.
Comparing Ratings Among Industry Peers
In this comparison, we explore the analyst ratings and average 1-year price targets of General Motors, Ferrari and Ford Motor, three prominent industry players, offering insights into their relative performance expectations and market positioning.
- Analysts currently favor an Outperform trajectory for General Motors, with an average 1-year price target of $88.0, suggesting a potential 80.4% downside.
- Analysts currently favor an Buy trajectory for Ferrari, with an average 1-year price target of $499.0, suggesting a potential 11.12% upside.
- Analysts currently favor an Neutral trajectory for Ford Motor, with an average 1-year price target of $14.09, suggesting a potential 96.86% downside.
Comprehensive Peer Analysis Summary
The peer analysis summary outlines pivotal metrics for General Motors, Ferrari and Ford Motor, demonstrating their respective standings within the industry and offering valuable insights into their market positions and comparative performance.
| Company | Consensus | Revenue Growth | Gross Profit | Return on Equity |
|---|---|---|---|---|
| Tesla | Outperform | 11.57% | $5.05B | 1.75% |
| General Motors | Outperform | -0.34% | $3.11B | 1.95% |
| Ferrari | Buy | 7.40% | $883.98M | 10.42% |
| Ford Motor | Neutral | 9.39% | $4.30B | 5.29% |
Key Takeaway:
Tesla ranks first in Revenue Growth among its peers, showing the highest percentage increase. In terms of Gross Profit, Tesla is at the top with the largest amount. However, Tesla has the lowest Return on Equity compared to its peers.
Delving into Tesla’s Background
Tesla is a vertically integrated battery electric vehicle automaker and developer of real world artificial intelligence software, which includes autonomous driving and humanoid robots. The company has multiple vehicles in its fleet, which include luxury and midsize sedans, crossover SUVs, a light truck, and a semi truck. Tesla also plans to begin selling a sports car and offer a robotaxi service. Global deliveries in 2024 were a little below 1.8 million vehicles. The company sells batteries for stationary storage for residential and commercial properties including utilities and solar panels and solar roofs for energy generation. Tesla also owns a fast-charging network and an auto insurance business.
A Deep Dive into Tesla’s Financials
Market Capitalization: Surpassing industry standards, the company’s market capitalization asserts its dominance in terms of size, suggesting a robust market position.
Revenue Growth: Tesla’s revenue growth over a period of 3 months has been noteworthy. As of 30 September, 2025, the company achieved a revenue growth rate of approximately 11.57%. This indicates a substantial increase in the company’s top-line earnings. In comparison to its industry peers, the company stands out with a growth rate higher than the average among peers in the Consumer Discretionary sector.
Net Margin: Tesla’s net margin surpasses industry standards, highlighting the company’s exceptional financial performance. With an impressive 4.89% net margin, the company effectively manages costs and achieves strong profitability.
Return on Equity (ROE): The company’s ROE is a standout performer, exceeding industry averages. With an impressive ROE of 1.75%, the company showcases effective utilization of equity capital.
Return on Assets (ROA): Tesla’s ROA stands out, surpassing industry averages. With an impressive ROA of 1.05%, the company demonstrates effective utilization of assets and strong financial performance.
Debt Management: Tesla’s debt-to-equity ratio is below industry norms, indicating a sound financial structure with a ratio of 0.17.
To track all earnings releases for Tesla visit their earnings calendar on our site.
This article was generated by Benzinga’s automated content engine and reviewed by an editor.